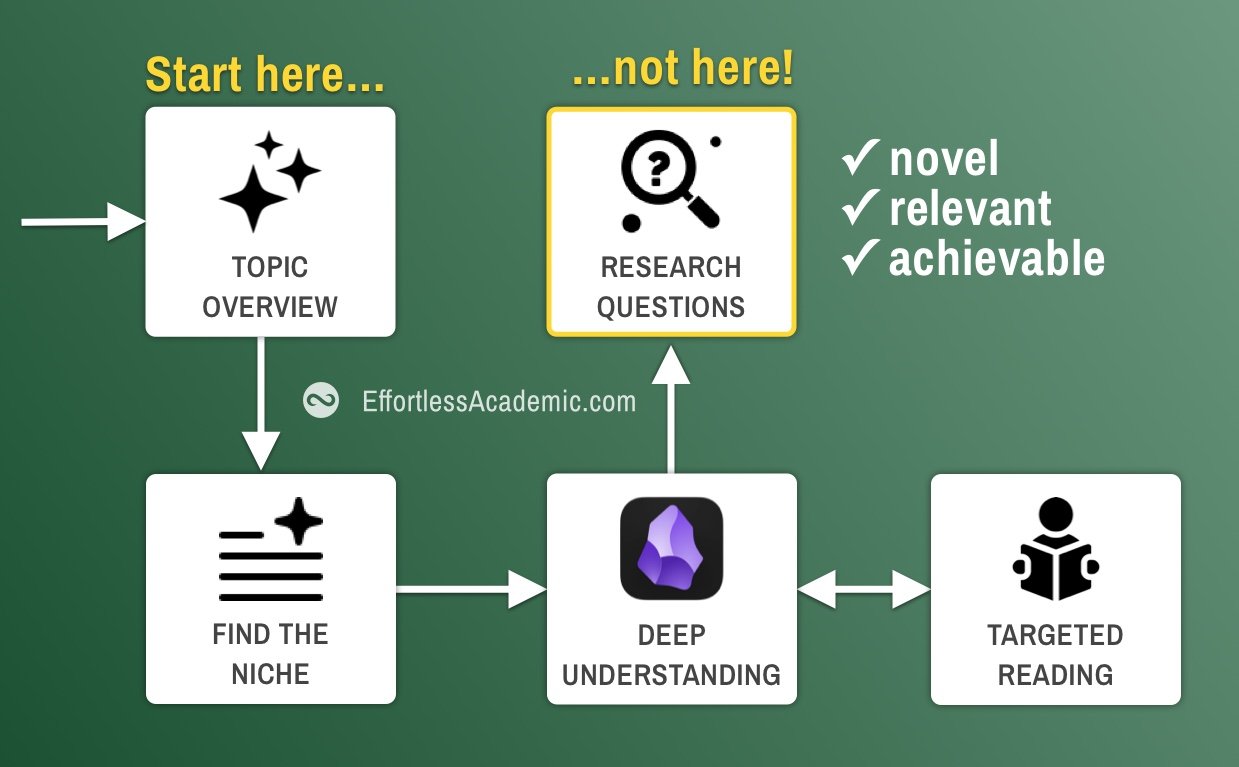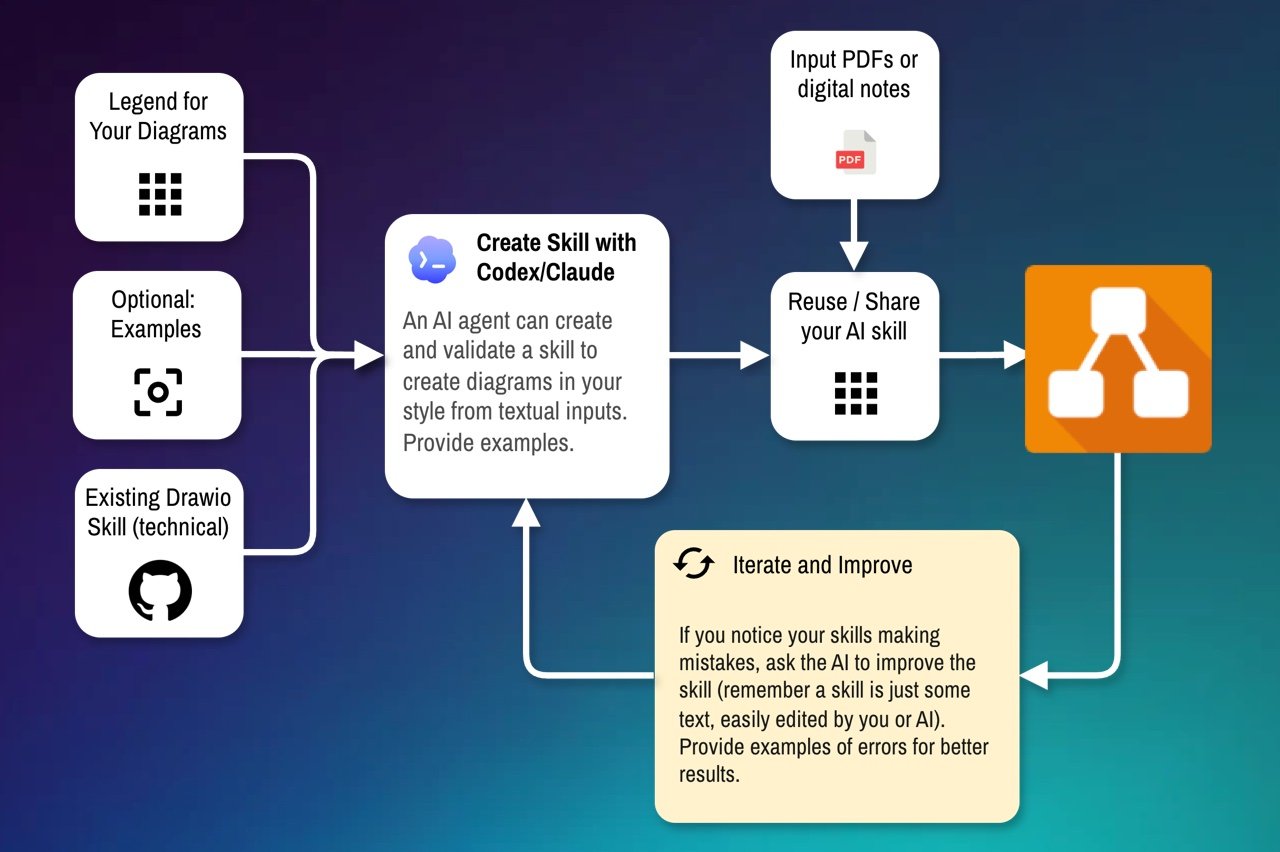
My go-to strategy for finding research gaps is by mapping out everything I know on a topic. Research gap then is typically a missing connection between two related concepts. The problem with these maps is that they can take days to create. In this tutorial, I want to experiment. I want to create a cloud skill that can shortcut the map creation. While the result is not perfect, it is a very solid first draft from which you can start double checking and improving the mind map.
Learn which tools can speed up your research: This free 21-day email series introduces you to a range of academic tools and how they work together to speed up the time needed for a literature review. Most of these tools have been around for less than a few years, some use AI. Knowing them gives you an almost unfair productivity advantage for your research.
Let’s first look at the end result and see how it can be useful. I used the skill we are going to create in this tutorial on this paper without any particular prompts. The output is a schematic of the paper, which allows me to understand it much more readily and ask the right questions or try to identify the gaps in the mechanisms the authors are describing.
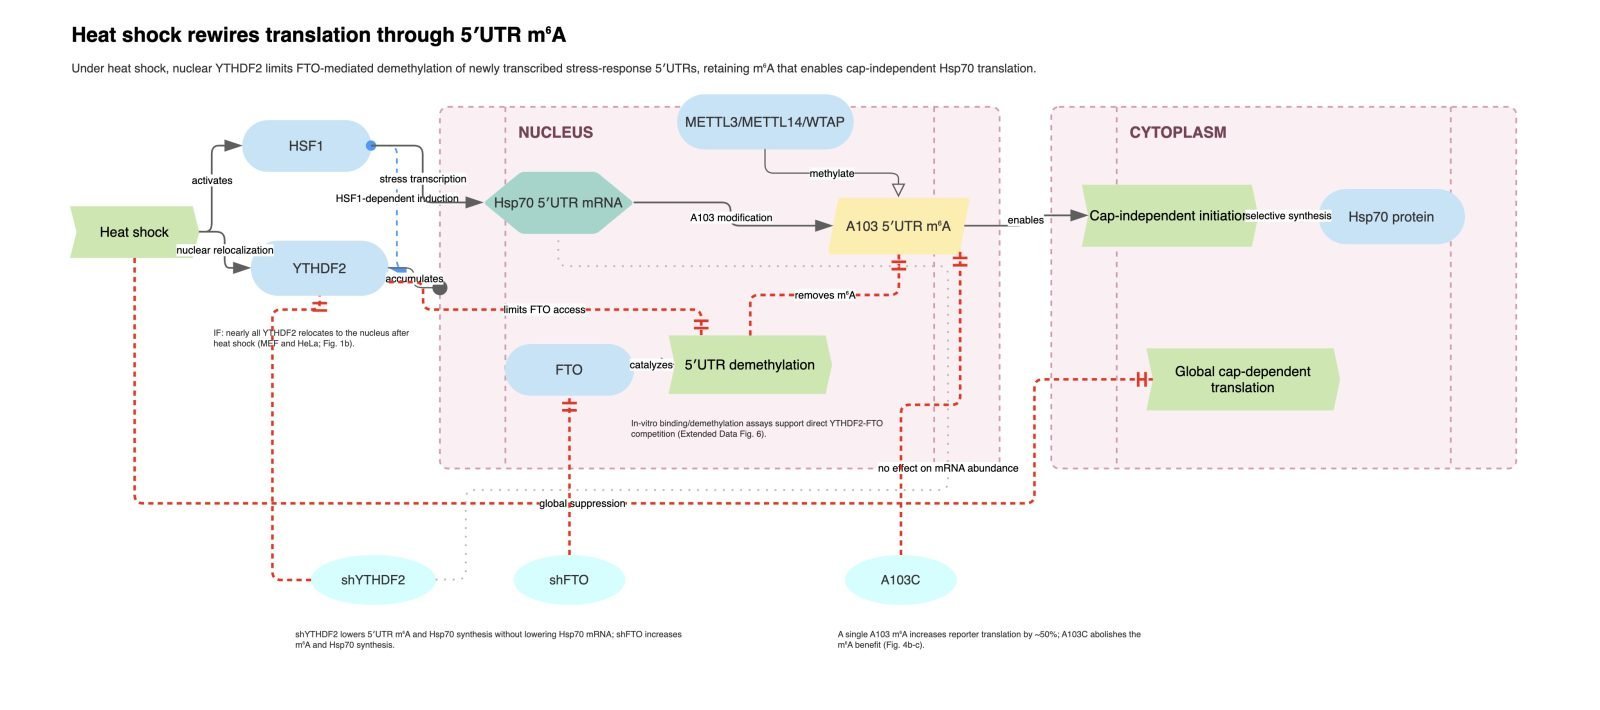
The colours and shapes all have specific meanings I defined previously, making the skill applicable only to one narrow domain: the stress responses of cells. To make it applicable to your domain, you need to create a skill for yourself. However, if you have a few examples and the visual language ready, this just takes a couple of minutes. Here is the workflow we are going to implement in this tutorial:
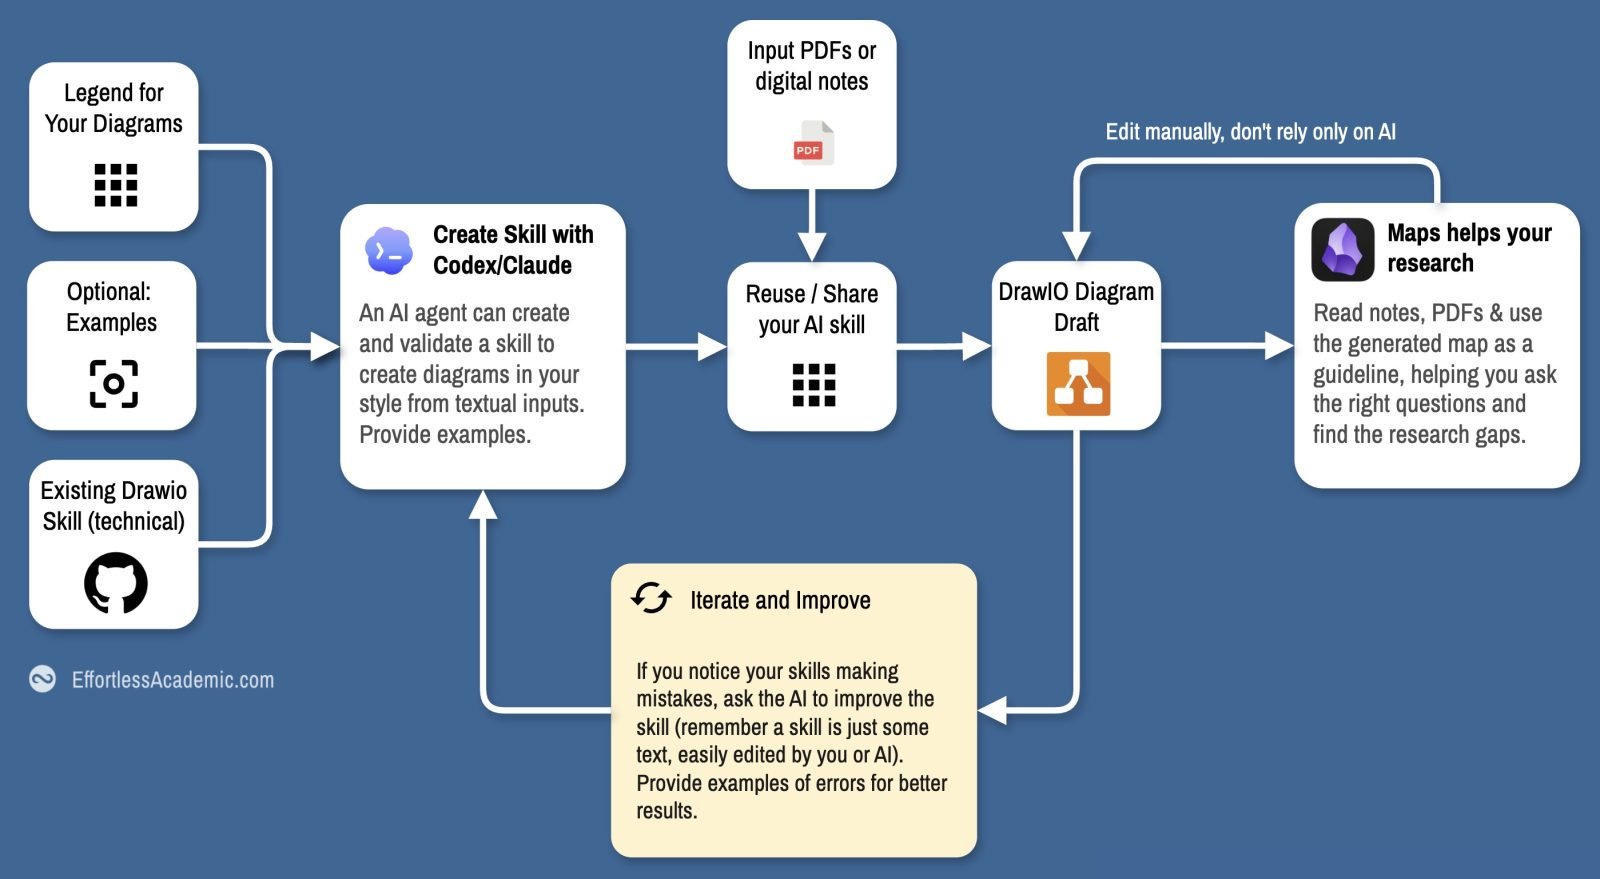
Here, I used OpenAI Codecs, but you’re welcome to use Claude Co-Work, which works equally well.
How to mindmap scholarly articles and research papers?
For a mind map to be effective, it needs to define a visual language that follows a set of rules. Here are the rules I refined for my own research:
- Every path through the diagram should be a valid sentence.
- Treat boxes as nouns and connections as verbs.
- The invisible is more important than the visible.
- Disconnected islands of nodes guide discovery.
- Develop a consistent (and beautiful) legend for your diagrams.
- Polish your diagrams as you would a scientific manuscript (it takes time).
Best software for mindmapping research articles
In my opinion, draw.io is easy to use, free, and extremely powerful for mind mapping. The reasons why you should use it:
- It works offline and online
- The outputs can be SVG files, which you can embed as images in note-taking software like Obsidian
- You can open the SVG files in your browser, too, which makes them shareable to people who don’t have the software installed.
- You can import libraries with icons and create templates for customising your use of it.
- It’s open-source and free
Dive into the beginner tutorial on using draw.io in this article:
If, like me, you’re a visual person, I have designed an entire course on synthesising ideas and finding research gaps using drawio.
Bad mind mapping example
Take a look at this mind map. Effectively, it’s just a list with “plant” being the main header and then a number of subheaders like “flowering”, with sub-subheaders of “flowers grow singly”/ “flowers grow in clusters”. Despite the graphical representation, this mind map is just a list.
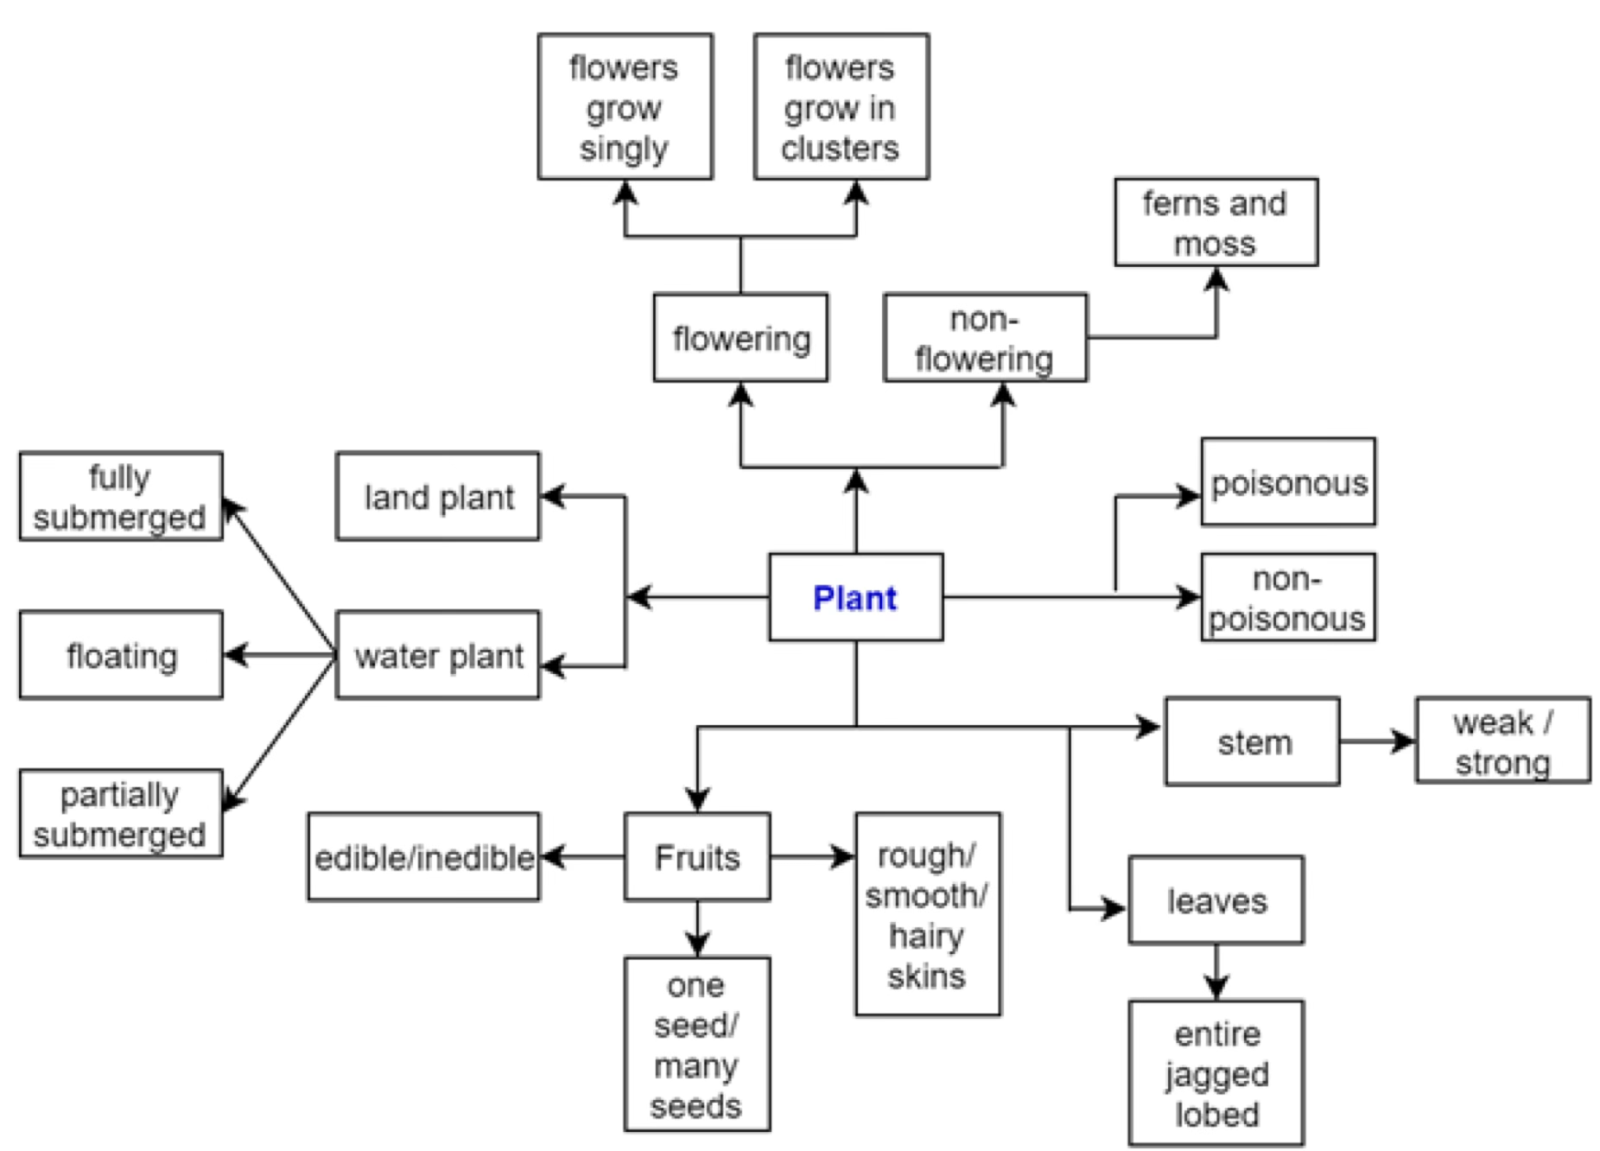
This is a typical example of a useless mind map because it only structures your data but does not create relations between concepts, which is what you need to spot research gaps. Let’s go through the rules needed for an effective mind map.
Rule #1: Every path through the diagram should be a valid sentence
Take a look at this diagram: Regardless of how you “walk” through it, a valid sentence is formed:
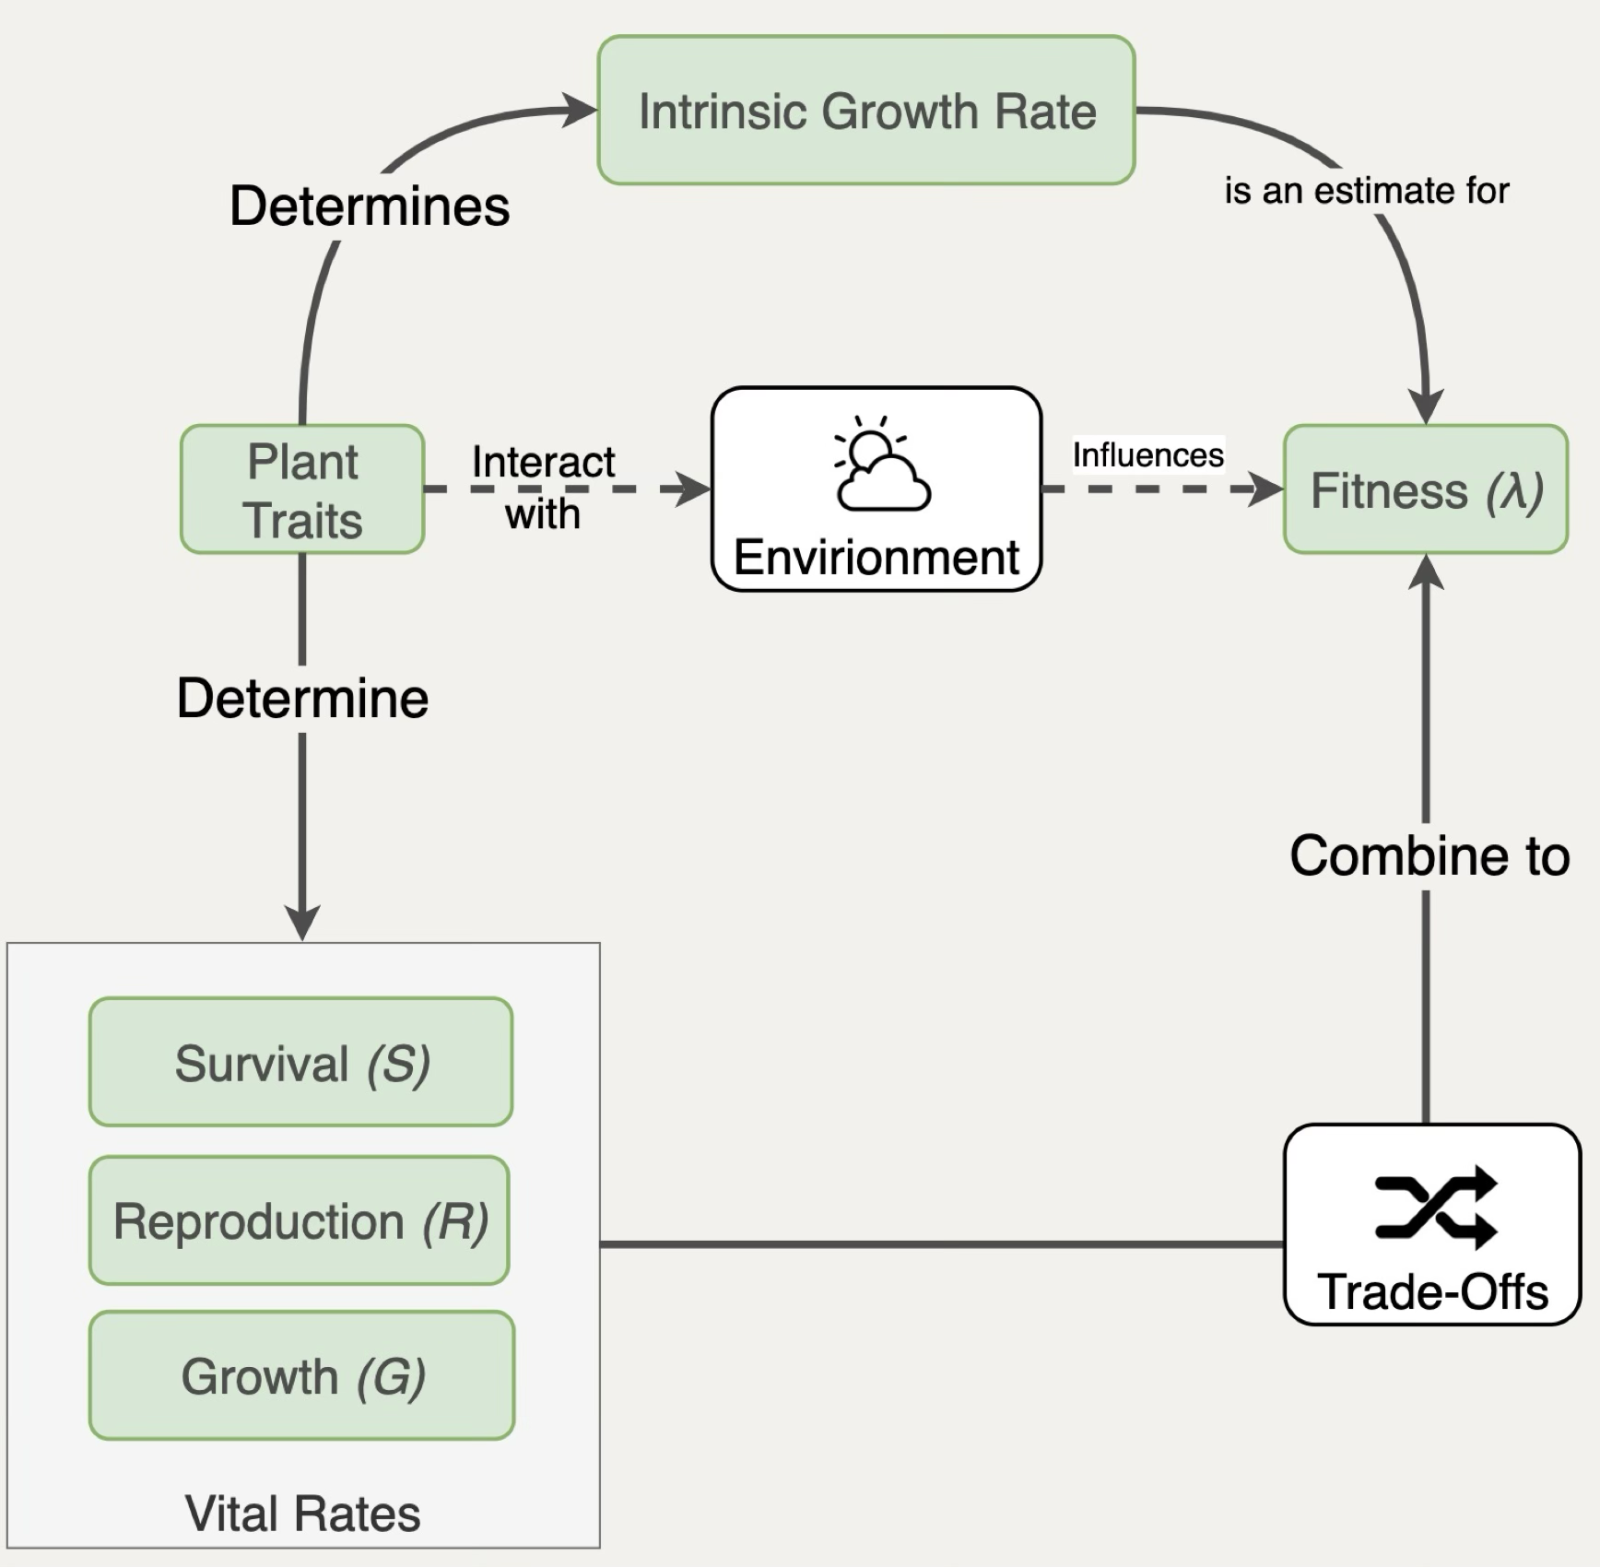
Walking the top arch, you could say “Plant traits determine the intrinsic growth rate (of a plant), which is used as an estimate for its Fitness” or walking the bottom arch: “Plant traits determine the vital rates (survival, reproduction and growth), which are combined to fitness but subject to various trade-offs”.
Both of these sentences communicate a different part of the research domain, and both are generally useful for understanding something about it!
Rule #2: Treat boxes as nouns and connections as verbs
When creating a visual language, think about what types of entities or concepts interact with each other and what the interactions between them could be. Here are a few examples:
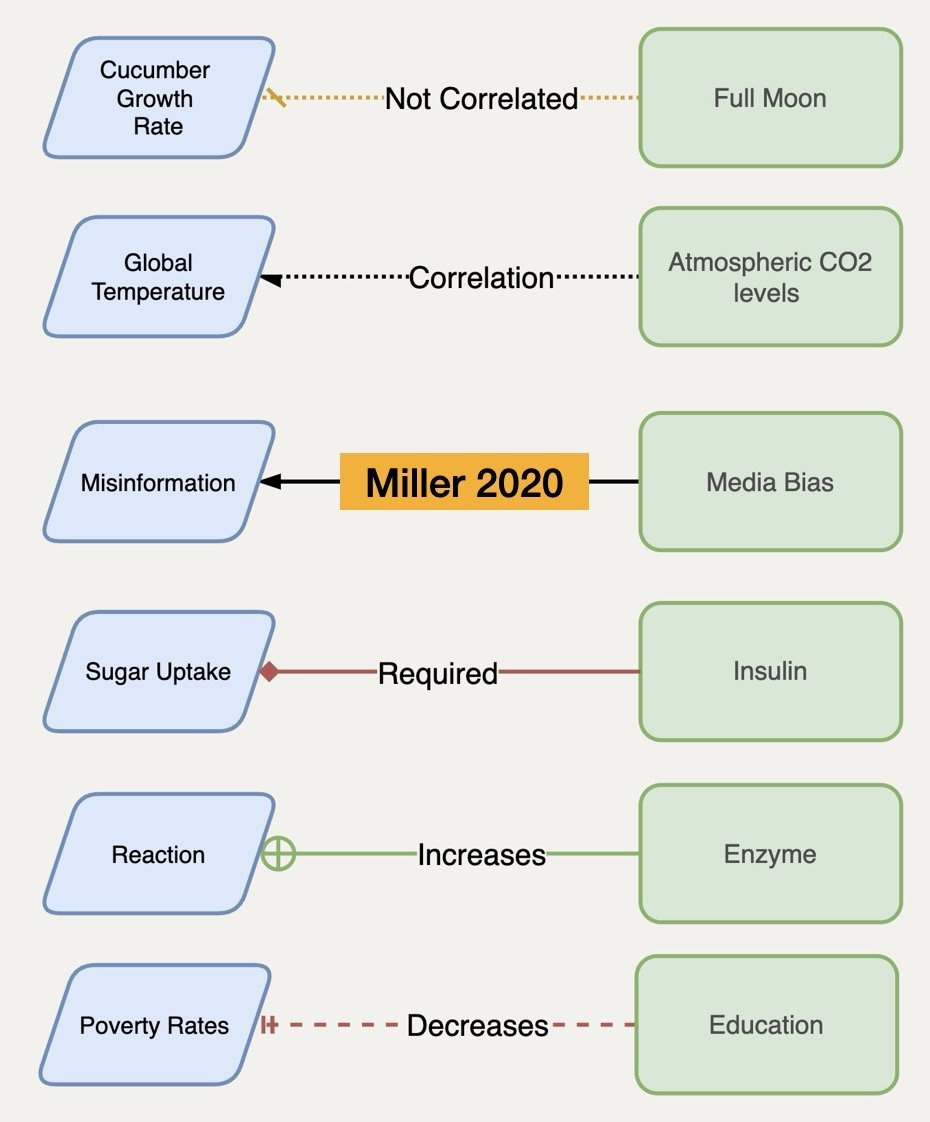
The colour and shape of the boxes and connections help you visually recognise what the resulting idea is built out of. There, you can pick any colour or shape you like, and that is easy for you to remember. That is exactly the deeply personal visual language that is being built here that you will need to create the AI automation.
Most Important part: because the verb is already communicated by the color and shape of the connection, you don’t need to write it out and can instead replace it with a paper that establishes that connection in the example above, for instance, the black arrow signifies “causation” and we can “read” that Miller 2020 established that media bias causes misinformation.
Rule #3: The invisible is more important than the visible.
Using our visual language, we can start mapping out ideas about a topic. The key here is to map everything you know, but keep an eye out for things that are disconnected.
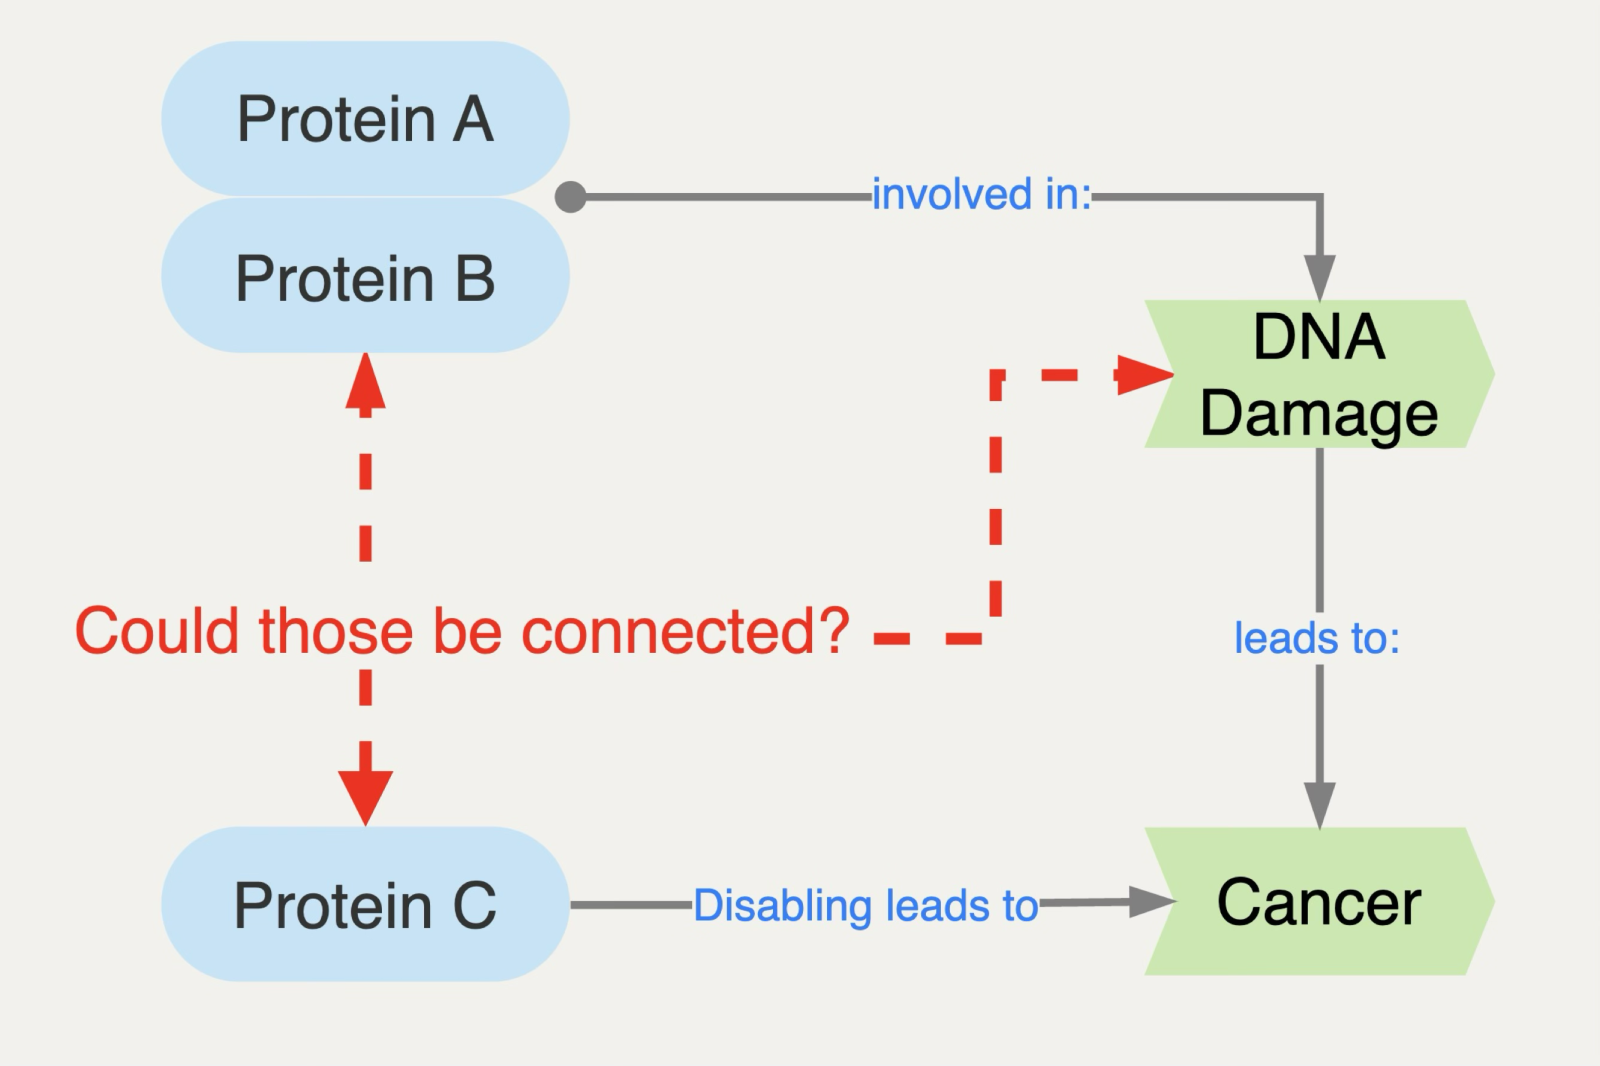
In the example above, proteins A and B are involved in DNA damage, which causes cancer, but we also know that protein C can lead to cancer. However, since protein C is not associated with DNA damage or with proteins A or B, we can ask whether there is an interaction that could explain mechanisms underlying cancer and possibly yield a novel research idea.
Rule #4: Disconnected islands guide discovery
Similar to missing connections, sometimes we deal with disconnected sub-parts of the domain. Trying to connect them somehow can facilitate finding this research gap.
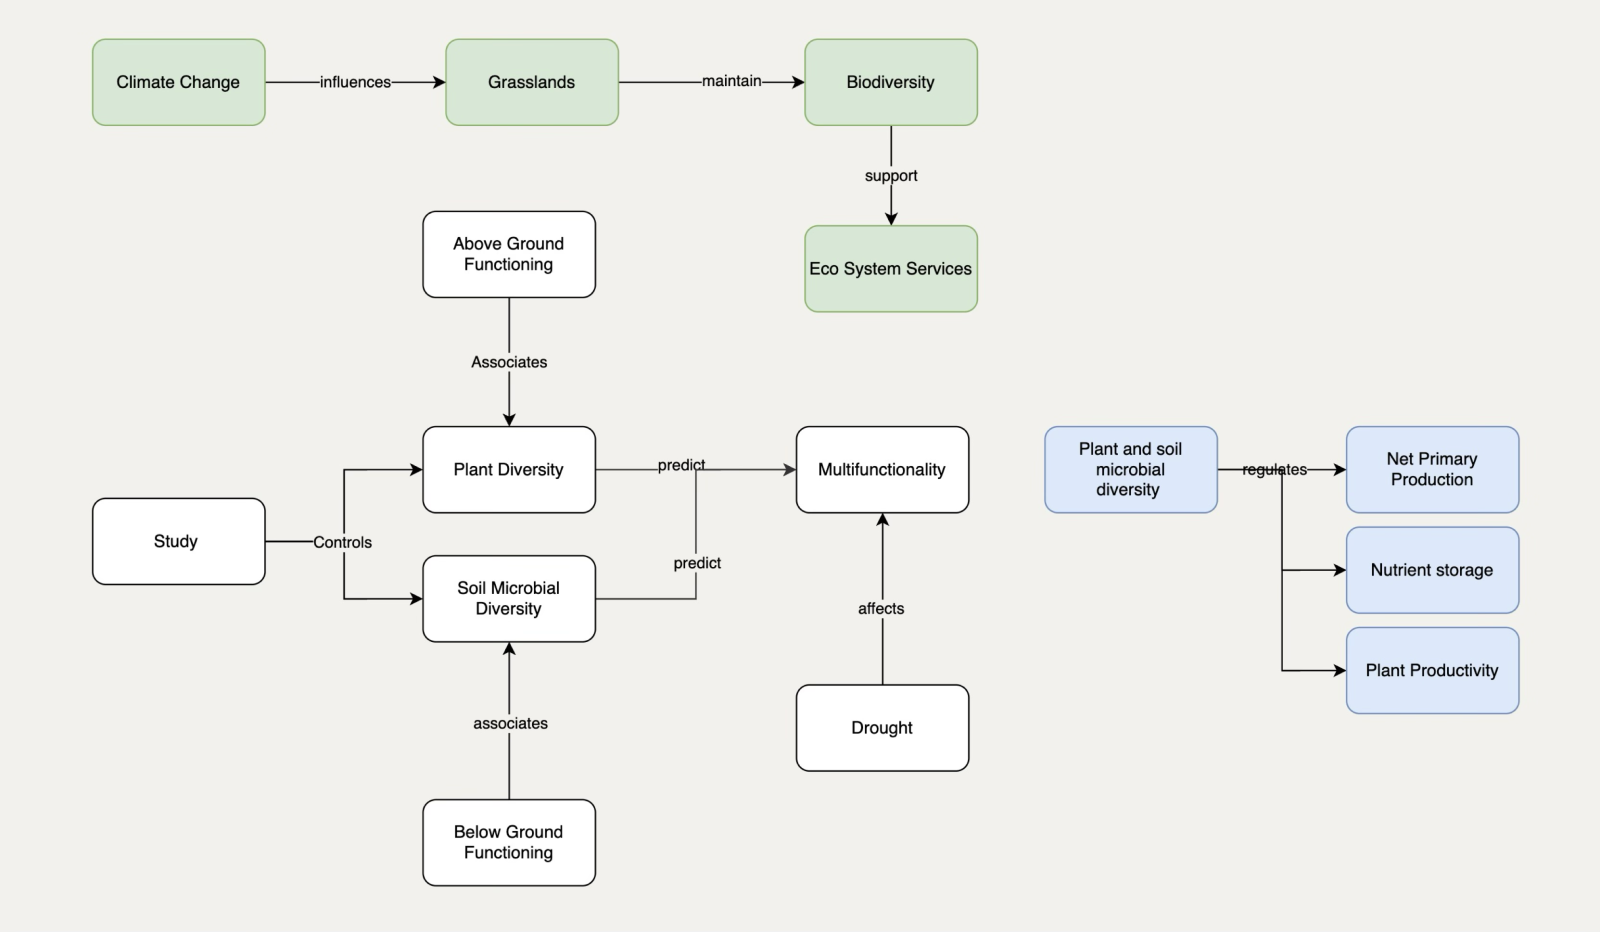
In the example above, the green line describes how climate change influences biodiversity and ecosystem services. It could be connected to the white island, which reflects plant and microbial diversity, allowing us to ask questions about how, for instance, soil affects biodiversity in grasslands.
Rule #5: Develop a consistent legend for your diagrams
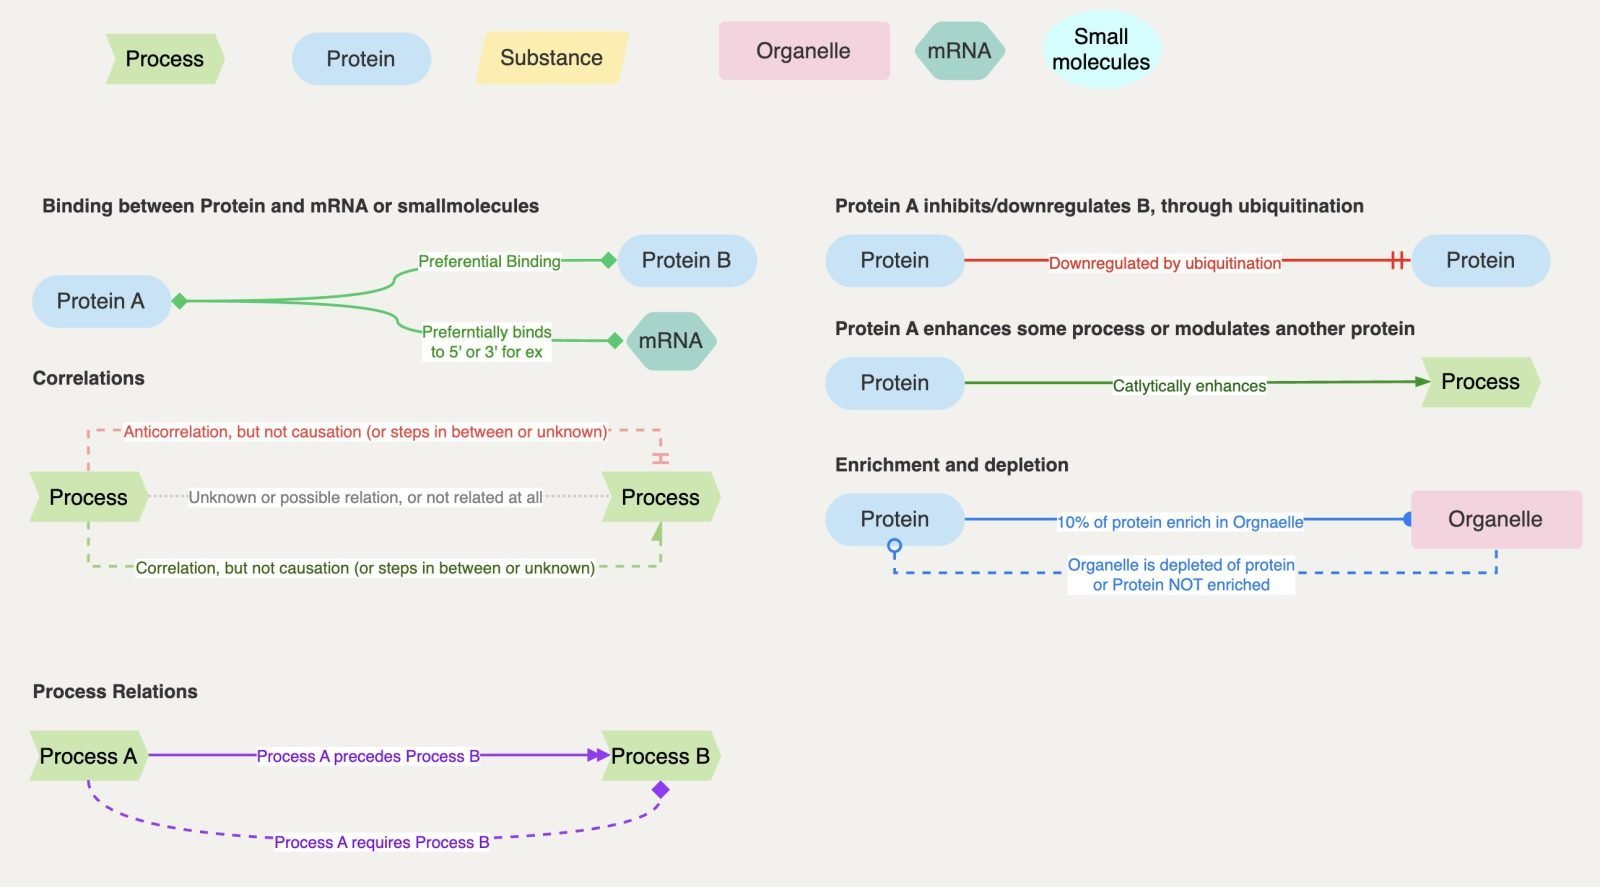
The key to this visual language, however, is consistency. It doesn’t matter what decisions you make. It only matters how clearly you apply them.
Rule #6: Polish your diagrams as you would a scientific manuscript (it takes time)
Polishing is what makes a diagram truly useful because you reinforce your visual language and arrange it so that it follows your thinking. Take a look at this initial first draft of a diagram.
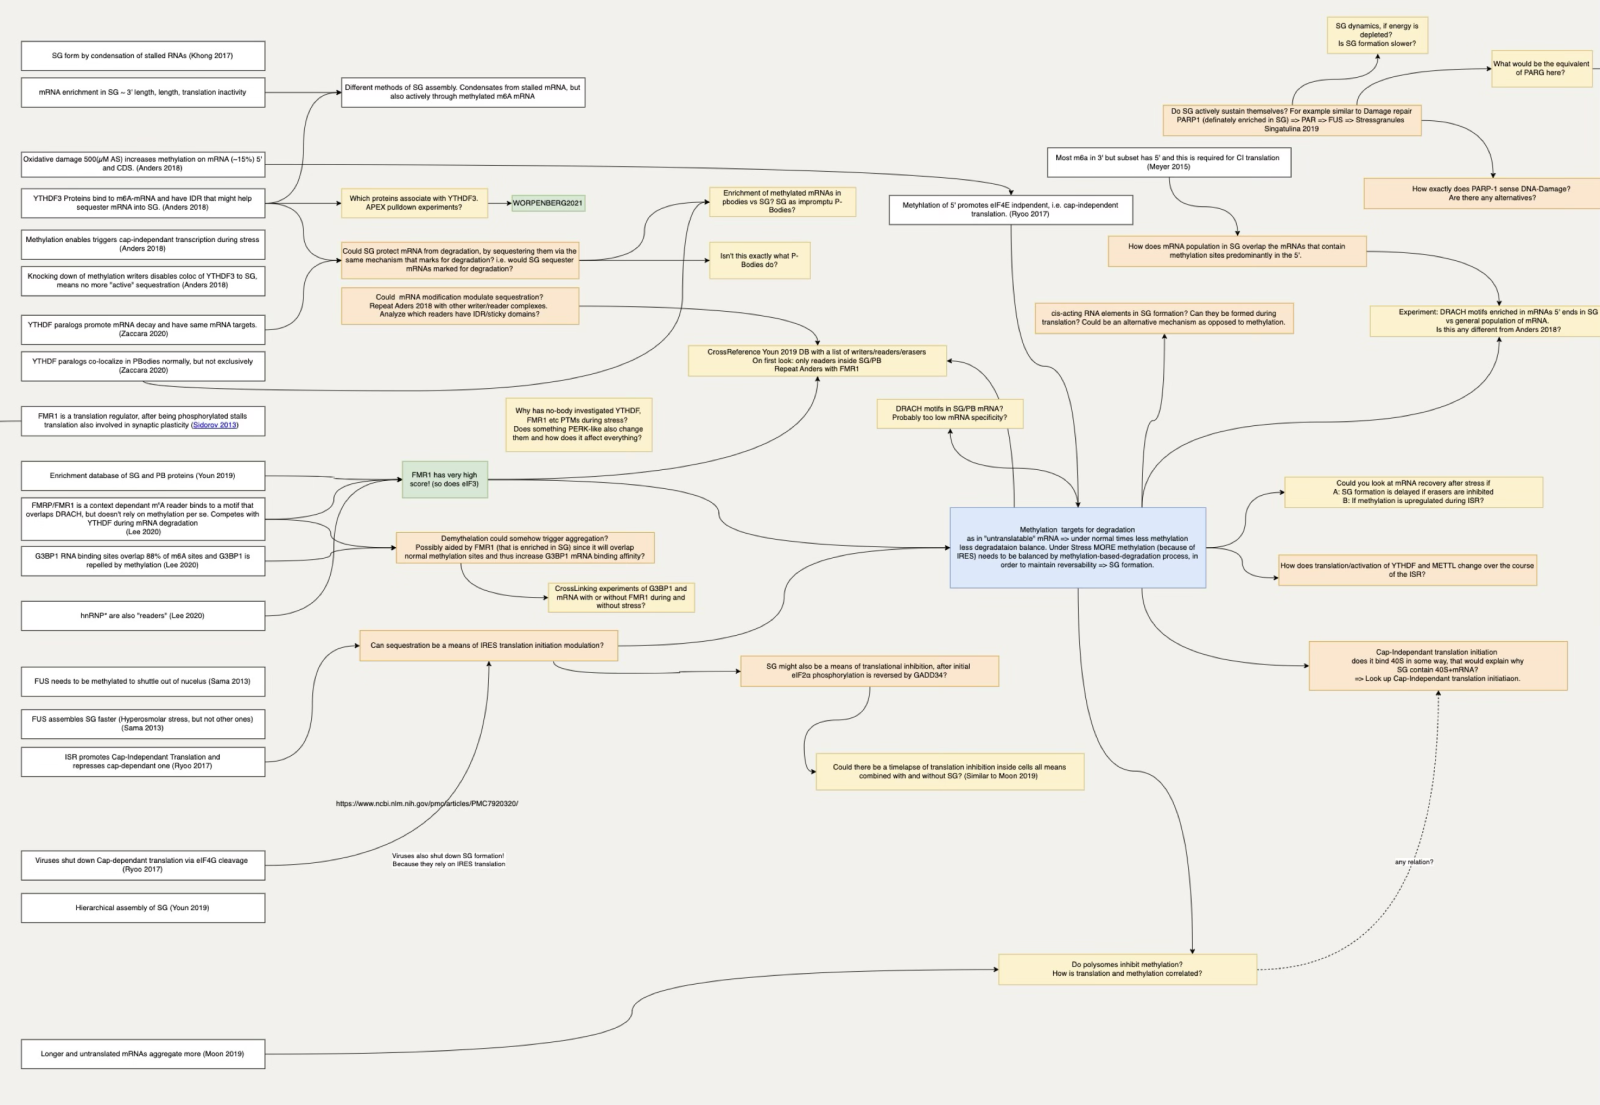
It is very chaotic, with arrows going in many different ways. While the colours have meaning, it’s not visually apparent what’s happening there, as this diagram is quite unpolished. Now, instead, take a look at this diagram:
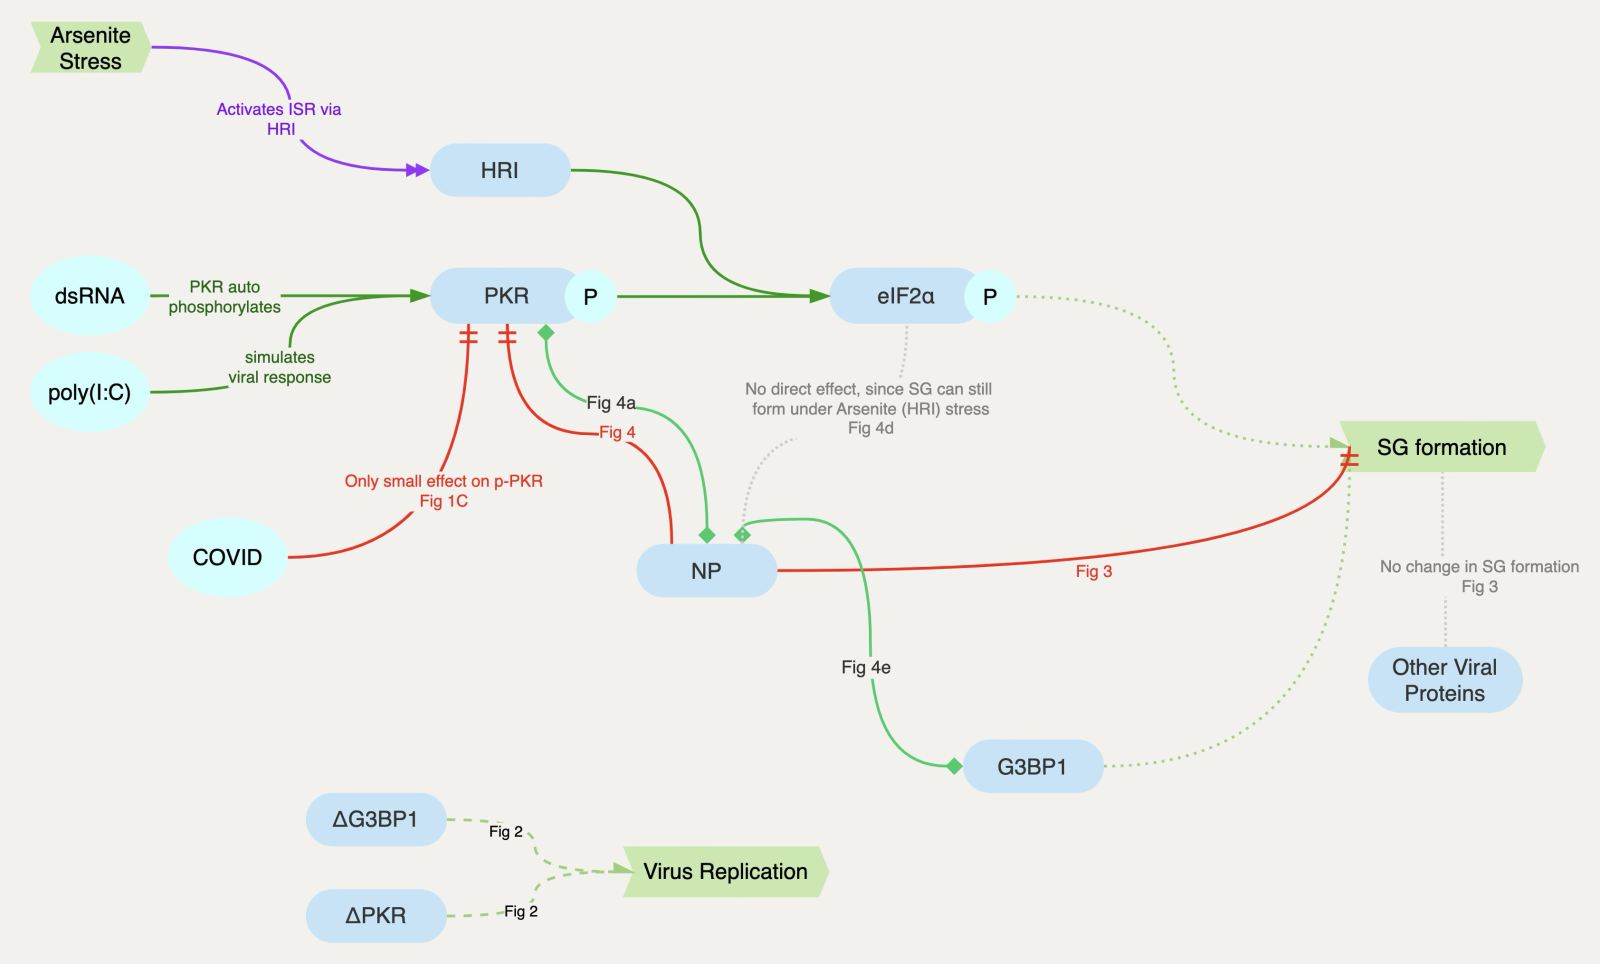
Here, you see a clear flow of information from left to right, allowing you to read through the diagram and gather insights. This often also includes breaking up massive mind maps like the one above into more digestible, bite-sized pieces.

Automating the research mind maps with an AI skill
These mind maps, as powerful as they are, are incredibly time-consuming, and a lot of this time is not spent understanding the subject matter but just arranging boxes and applying styles and colours. That’s exactly what we can automate by creating a skill that generates these first drafts of a mind map.
If you don’t know what an AI skill is, think of it as a set of instructions on how an AI can do a specific task. In contrast to a prompt, however, a skill is usually much larger and can contain additional files, examples, templates, and even scripts that it can execute to achieve its goal. If you have never built skills before, read through the skills tutorial before continuing.
Let’s go step by step.
Step 1: Create the DrawIO template
Since you have your legend with the visual language and maybe a few examples, create one draw.io file which contains both of them on separate pages so that you can give it to the AI and let it copy your styles and conventions. The more detailed these examples (2) and legends (1) are, the easier it will be for the AI to do exactly what you need. Here’s my example:
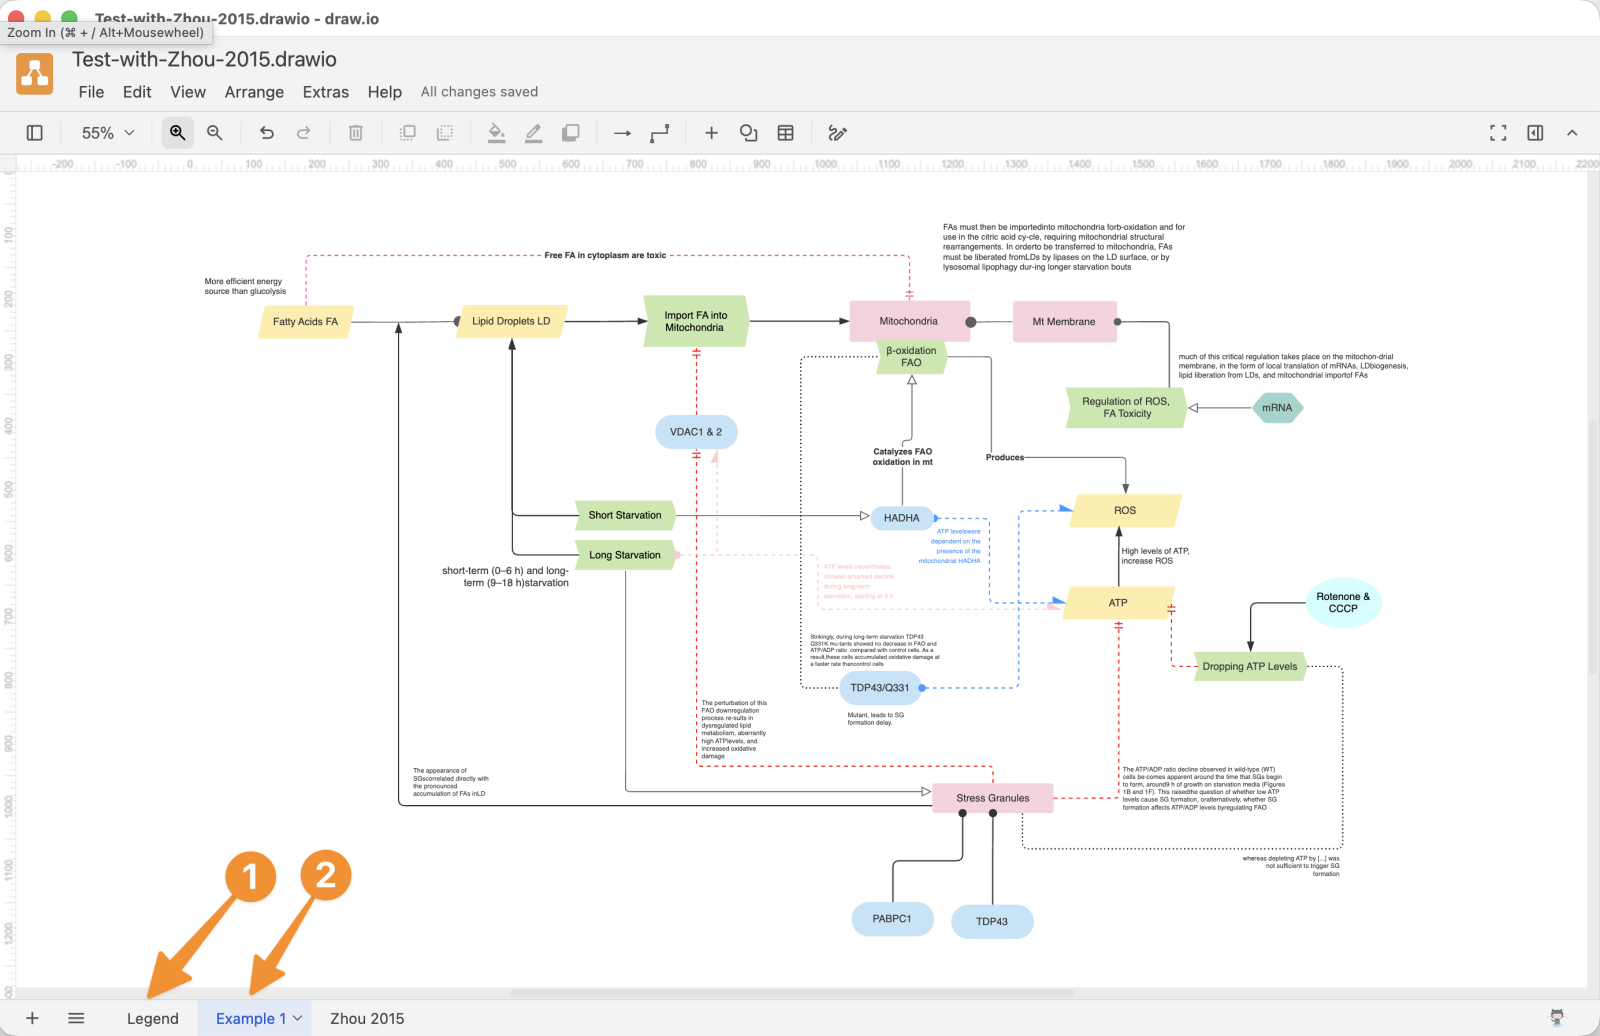
I typically create different pages for the parts, which is done at the bottom of the UI.
Step 2: Download the technical description of the DrawIO format
To create draw.io files, AI needs to know exactly how they are technically built. Currently, there are a few such skills available; however, most of them are intended for a technical purpose, like documenting code. Since the technical details of draw.io don’t change regardless of use case, you can use any of these skills to teach Codex how to handle and create draw.io files.
You can, for example, install this skill as a baseline for the technical details. Just copy it into your ~/.agents/skills folder (“~” stands for the user folder and is the same on Windows).
Step 3: Build the Skill with AI
Finally, upload your example and visual language drawing file (1). Link the technical description skill (2) and describe exactly what’s in your file and what you would like to create (3).
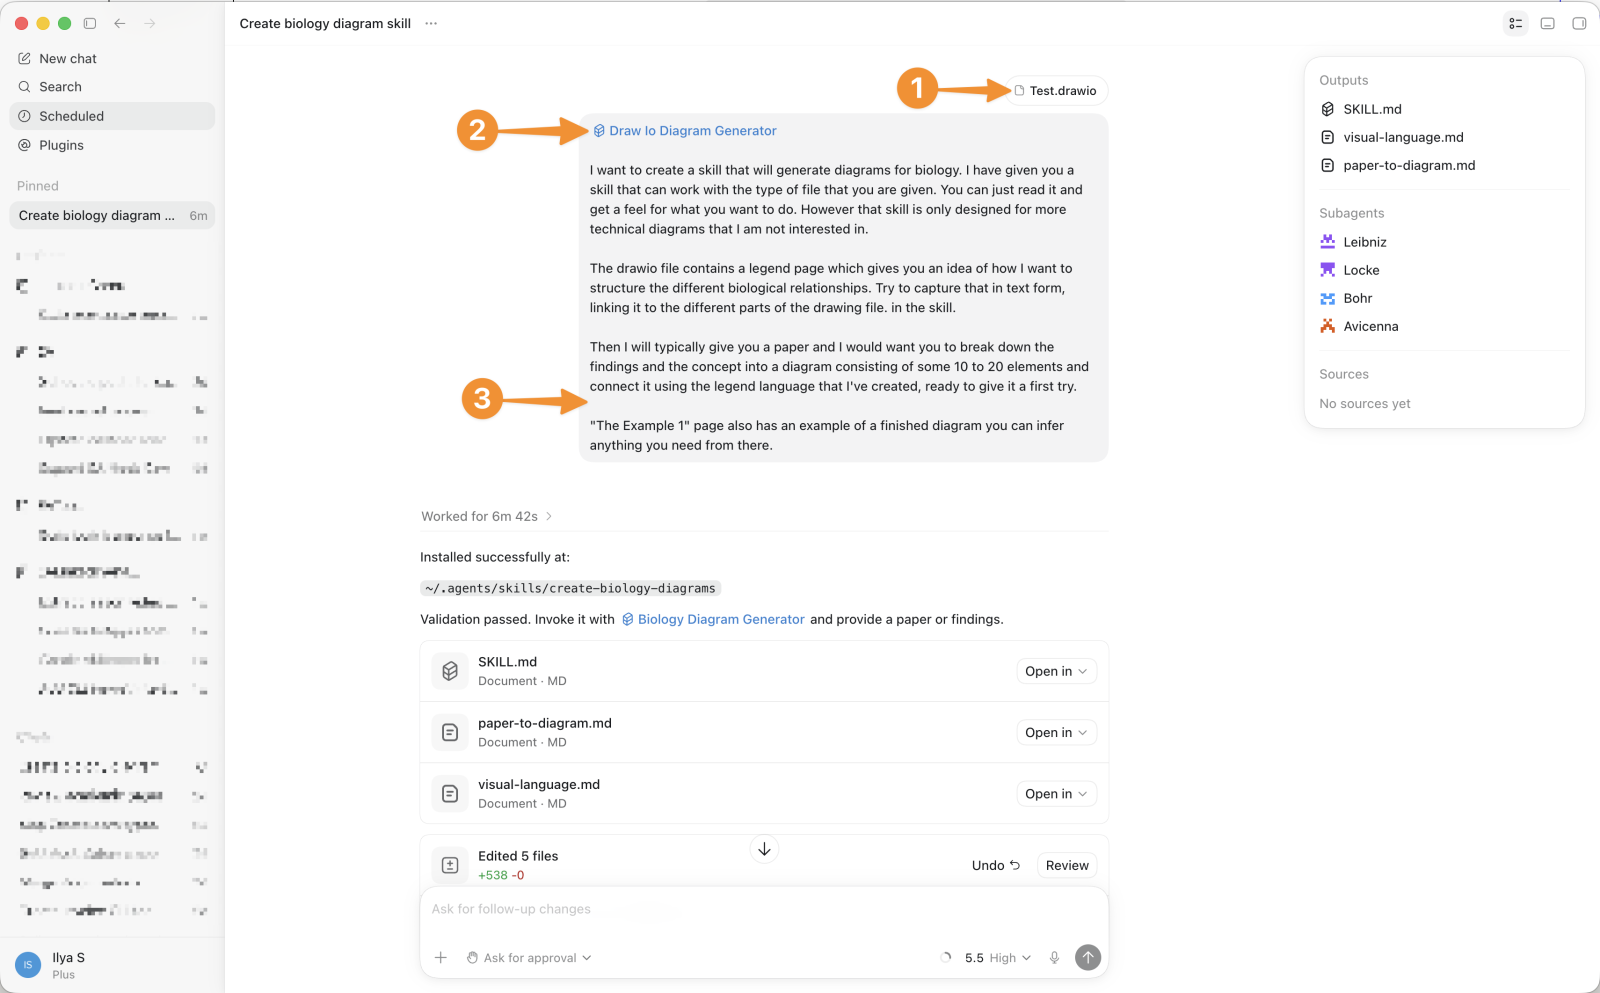
Today’s models are typically smart enough to figure out how to do something, so focus on stating the goal clearly and specifying the types of input and output you expect, rather than defining the individual steps.
Note: Codex will install your skill into the user folder under .agents or .codex. If you want it to be accessible in Claude Code as well, copy or symlink ot to ~/.claude/skills as well. (You can ask codex to do this step for you).
Step 4: Test and iterate
This last step is probably self-explanatory. No skill is good enough from the start. The approach I usually use is to pin the conversation that created the skill, and whenever the skill creates errors, you can go back to this conversation, present the error, and let the AI know what to fix.
Here is my OpenAI Codex installation, with the skill creation script pinned to the top (1). If you look at the diagram screenshot at the beginning of this article, it’s not super pretty, so I’m asking the AI to make a few changes and update the skill (2).
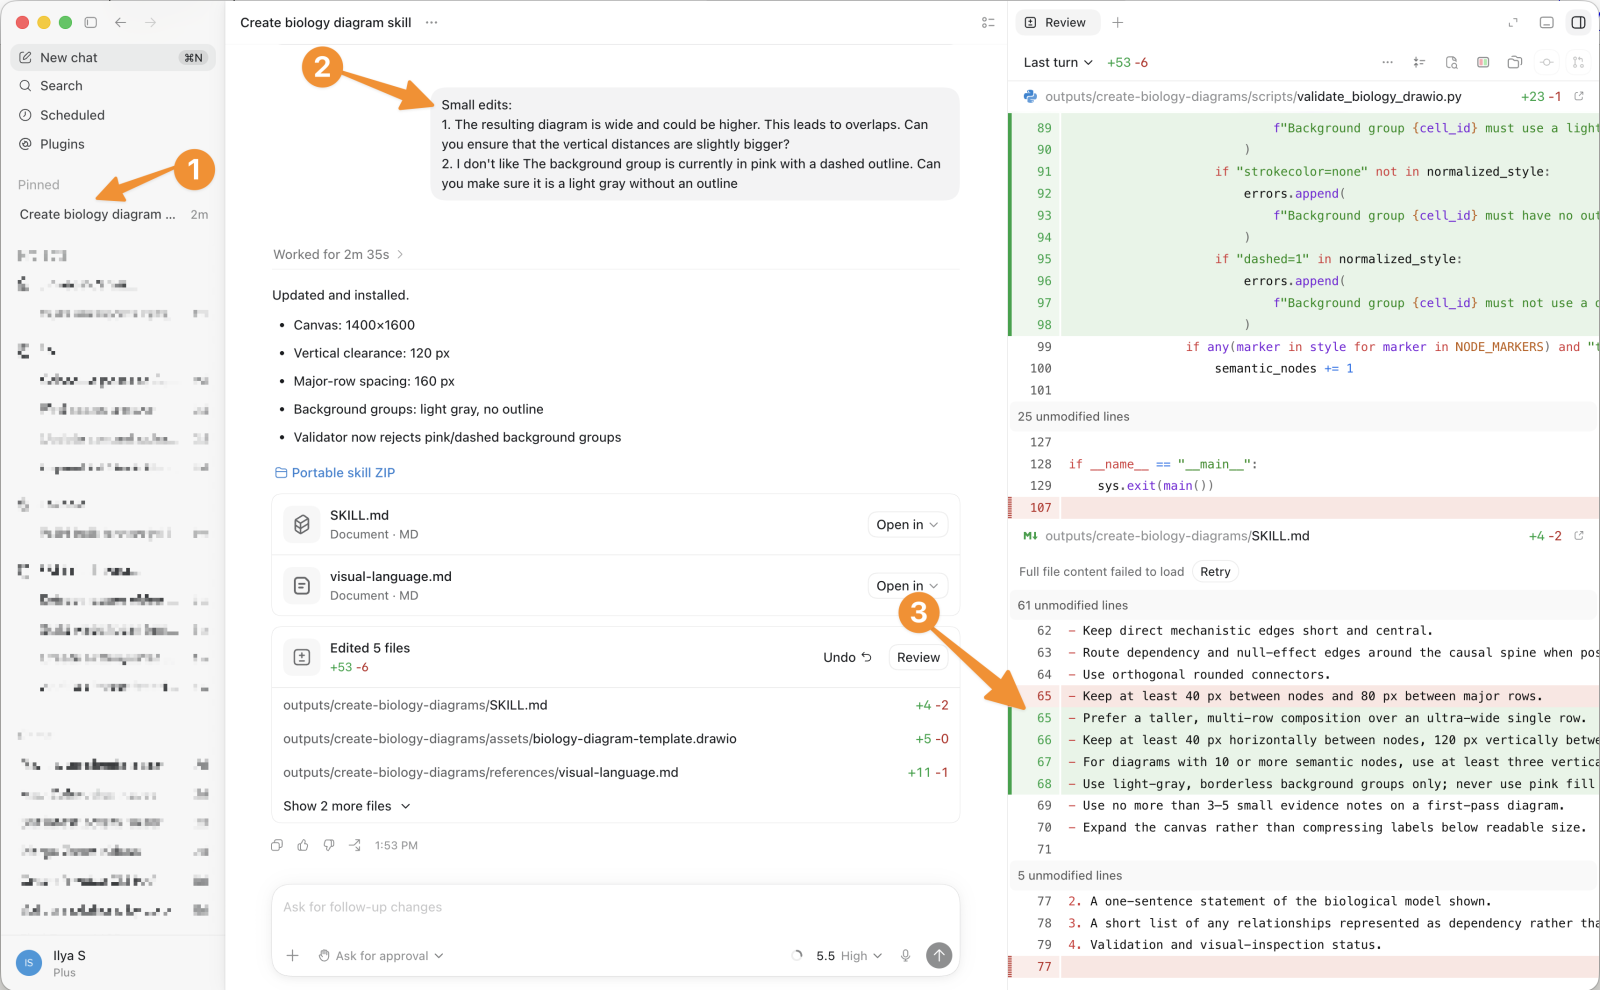
After a few minutes, you can review the updates (3) and rerun the skill. Here is the result:
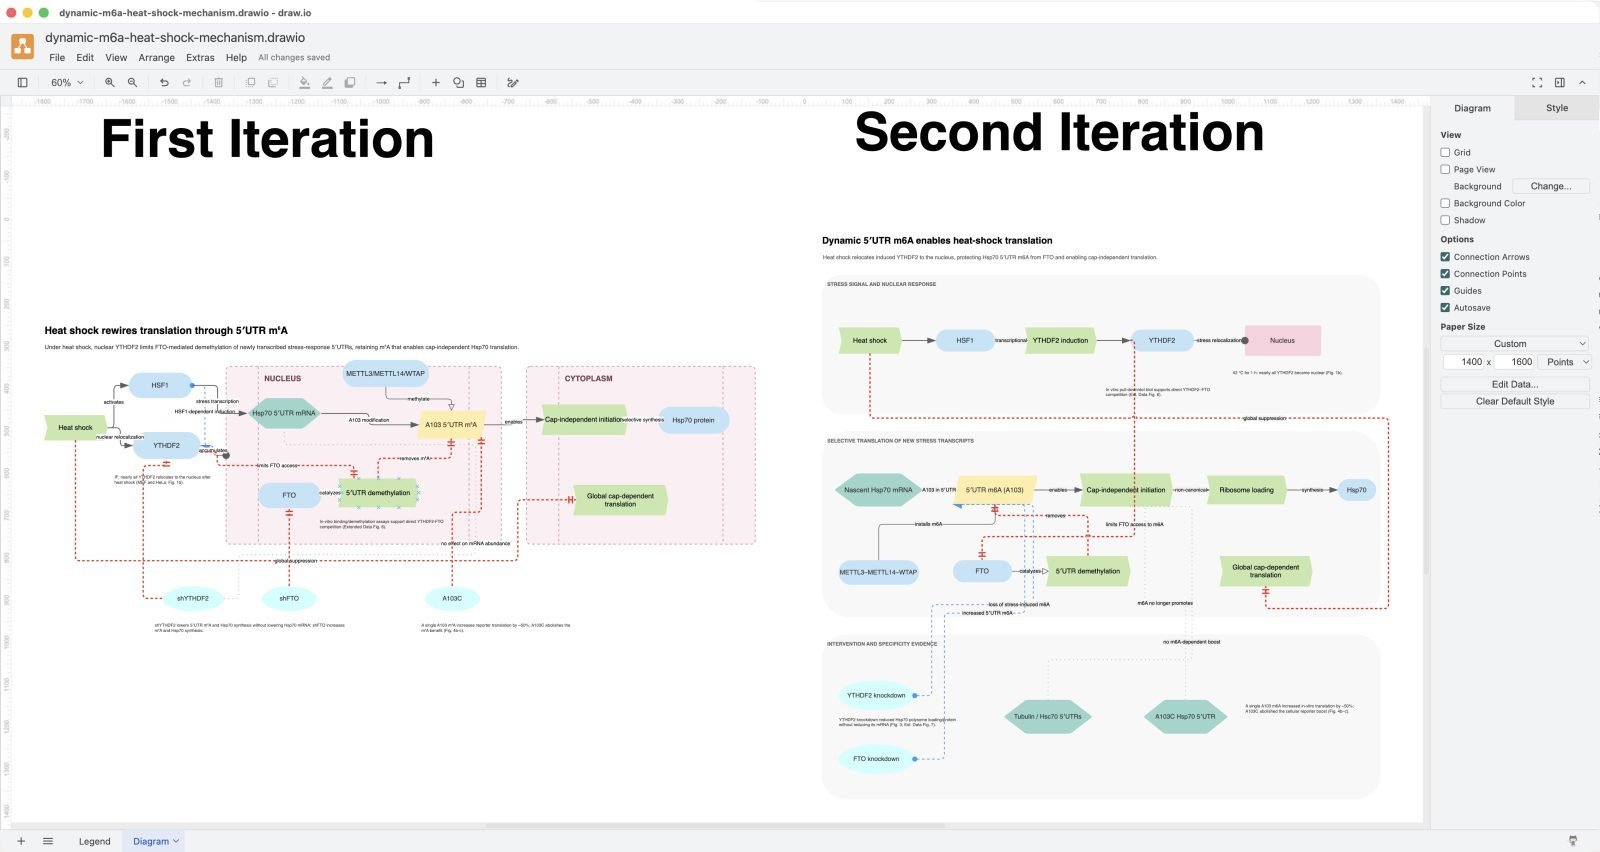
Notice that the diagram became a lot clearer and that the boxes now have the grey outline as demanded. Keep in mind that every time you rerun the skill, your diagrams will look slightly different, as AI is unpredictable.
Step 5: Continue working on it manually
Your work is not done by just putting something through an AI. Use the output as a first draft to outline a research domain, and critically double-check all the connections and work from there. Use the diagram to enhance your understanding and speed up knowledge acquisition. My suggestion is to keep editing manually after the first pass of the AI skill. Since asking AI to edit small details will be quite slow (It took the AI about 7 minutes to create the diagram)
Spotting the research gap using the mind map
You can spot the research gap in a few ways, which will become apparent as you work with a mind map:
- Missing connections are the biggest indicator of research gaps, especially if they can be replaced with a hop over multiple other connections. This could help explain why the gap exists and what the solutions might be.
- Connections often have associated studies. A lack of studies indicates that something might be speculative.
- Similarly, if the studies are too old, you could reassess the findings and contrast them with what is known today.
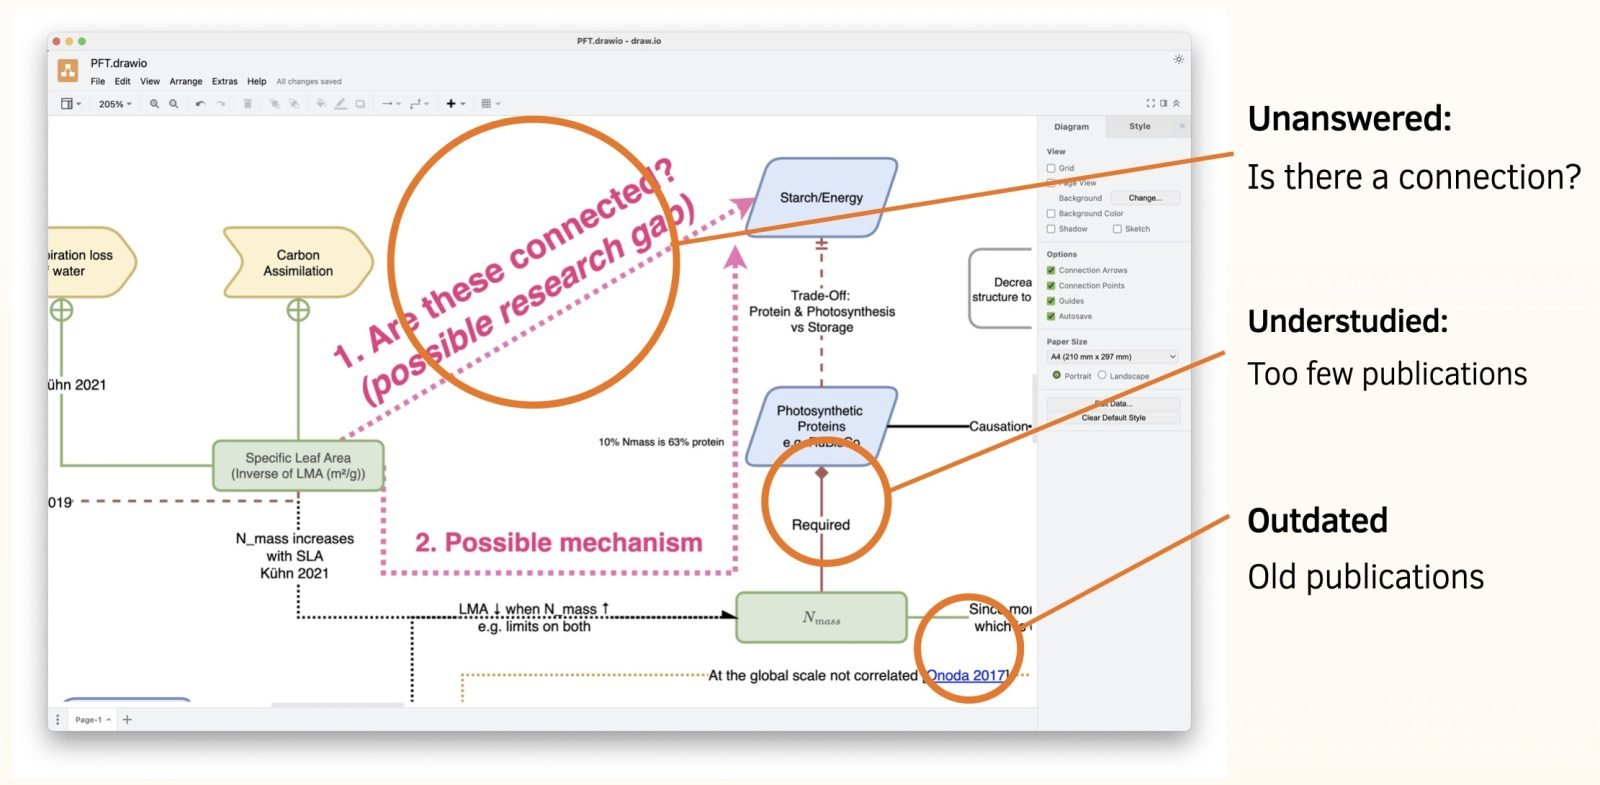
There is no single recipe for how you will find the research gap, but once you have mapped out everything you know, what you don’t know becomes quite apparent. So experiment and iterate to find your personal strategy.
Summary
In this article, I outlined how we can build effective research maps by following a set of rules. The most important rules are that each box represents a concept and each connection represents a verb, so that we can form paths through the diagrams, resulting in valid sentences. Over time, this creates a visual language that we can polish to perfection and truly master a high-level overview of a domain.
Next, we can plug in a few examples we created by hand, along with our legend and the technicalities of how Draw.io works, to create a skill that will generate diagrams in a similar fashion. The process is quite simple, but requires a little bit of time to iterate and get right. Experiment with this setup and create the perfect research workflow, making your academic journey effortless and productive.